
Advertisement
Derby City Council
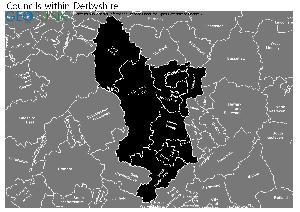
Map of the Derby City Council Area
The area shaded blue on the map represents the extent of Derby City Council. The map pin represents the location of the council offices.
Waste Recycling Performance
246 (71.30%) of local authorities perform better than Derby City Council.
98 (28.41%) of local authorities perform worse than Derby City Council.
Derby City Council has a population of 239,200.
Derby City Council is within the ceremonial county of Derbyshire
click to enlarge
Download Print Quality PDF of Councils in Derbyshire
Councils Neighbouring Derby City Council
Wards within Derby City Council
click to enlarge
.jpg)
- Abbey
- Allestree
- Alvaston
- Arboretum
- Blagreaves
- Boulton
- Chaddesden
- Chellaston
- Darley
- Derwent
- Littleover
- Mackworth
- Mickleover
- Normanton
- Oakwood
- Sinfin
- Spondon
Download Print Quality PDF of Wards in Derby City Council
Derby City Council Contact Details
| Website | http://www.derby.gov.uk/ |
| Contact Us Page | http://www.derby.gov.uk/contact-the-council/ |
| Address | The Council House |
| Corporation Street | |
| City | Derby |
| County | Derbyshire |
| Postcode | DE1 2FS |
| Telephone Number Description | General enquiries |
| Telephone Number | 01332 293 111 |
| Fax Number | 01332 643 549 |
| Main Contact Email | [email protected] |
Details for Derby City Council
| Local Authority Name | Derby City Council |
| SNAC Code | 00FK |
| Postcode | DE1 2FS |
| Latitude | 52.9231943758 |
| Longitude | -1.4739969304 |
| Country | England |
| NHS Health Authority | East Midlands |
| Parliamentary Constituency | Derby South |
| European Electoral Region | East Midlands |
| Primary Care Trust | Derby City |
| Region | East Midlands |
| Admin County | |
| ONS Code | E06000015 |
Political Make Up of Derby City Council
| Type | |
|---|---|
| Party with overall control | Coalition: CON min |
| Labour | 16 |
| Liberal Democrats | 7 |
| Conservative Party | 17 |
| Green Party | 0 |
| UK Independence Party | 0 |
| Plaid Cymru - The Party of Wales | 0 |
| Scottish National Party | 0 |
| Democratic Unionist Party | 0 |
| Sinn Féin | 0 |
| Ulster Unionist Party | 0 |
| Social Democratic and Labour Party | 0 |
| Traditional Unionist Voice | 0 |
| Progressive Unionist Party | 0 |
| Independent | 9 |
| Vacant | 2 |
| Electoral Cycle Start Date | 2016 |
| Electoral Cycle End Date | 2030 |
2022 Election Results for Derby City Council
| Council Seats up for Election | Third |
|---|---|
| Labour | 16 |
| Liberal Democrats | 8 |
| Green Party | 0 |
| Conservatives | 18 |
| Others | 9 |
| Vacant Seats | 0 |
Waste and Recycling Rates for Derby City Council 2017-18
Waste Recycling Performance
246 (71.30%) of local authorities perform better than Derby City Council.
98 (28.41%) of local authorities perform worse than Derby City Council.
| Authority Type | Unitary |
|---|---|
| Waste per household KG | 605.0 |
| Percentage of household waste sent for reuse, recycling or composting | 36.30% |
| Collected household waste per person (kg) | 401.2 |
Employee Headcount for Derby City Council
FTE = Full Time Equivalent
| Region | East Midlands |
|---|---|
| Total Headcount | 6489 |
| Total FTE | 4865 |
| Male Full Time | 1157 |
| Female Full Time | 1831 |
| Male Part Time | 377 |
| Female Part Time | 3121 |
| Permanent | 5664 |
| Temporary/Casual | 824 |
| Male | 1535 |
| Female | 4953 |
| Full-time | 2989 |
| Part-Time | 3499 |
| Male Full Time perm | 1077 |
| Female Full Time perm | 1631 |
| Perm Male | 1360 |
| Perm Female | 4303 |
| Perm Full-time | 2709 |
| Perm Part-time | 2954 |
| Male total FTE perm | 1247 |
| Female total FTE perm | 3123 |
| Male Full Time temp | 79 |
| Female Full Time temp | 199 |
| Temp Male | 174 |
| Temp Female | 649 |
| Temp Full-time | 279 |
| Temp Part-time | 544 |
| Male total FTE temp | 104 |
| Female total FTE temp | 389 |