
Cherwell District Council
Map of the Cherwell District Council Area
The area shaded blue on the map represents the extent of Cherwell District Council. The map pin represents the location of the council offices.
Waste Recycling Performance
31 (8.99%) of local authorities perform better than Cherwell District Council.
313 (90.72%) of local authorities perform worse than Cherwell District Council.
Cherwell District Council has a population of 138,200.
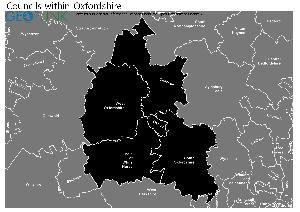
Cherwell District Council is within the ceremonial county of Oxfordshire
click to enlarge
Download Print Quality PDF of Councils in Oxfordshire
Councils Neighbouring Cherwell District Council
Wards within Cherwell District Council
click to enlarge

- Adderbury, Bloxham and Bodicote
- Banbury Calthorpe and Easington
- Banbury Cross and Neithrop
- Banbury Grimsbury and Hightown
- Banbury Hardwick
- Banbury Ruscote
- Bicester East
- Bicester North and Caversfield
- Bicester South and Ambrosden
- Bicester West
- Cropredy, Sibfords and Wroxton
- Deddington
- Fringford and Heyfords
- Kidlington East
- Kidlington West
- Launton and Otmoor
Download Print Quality PDF of Wards in Cherwell District Council
Cherwell District Council Contact Details
| Website | http://www.cherwell-dc.gov.uk/ |
| Contact Us Page | http://www.cherwell.gov.uk/index.cfm?articleid 1136 |
| Address | Bodicote House |
| Bodicote | |
| Town | Banbury |
| County | Oxfordshire |
| Postcode | OX15 4AA |
| Telephone Number Description | General enquiries |
| Telephone Number | 01295 252 535 |
| Fax Number | 01295 270 028 |
Details for Cherwell District Council
| Local Authority Name | Cherwell District Council |
| SNAC Code | 38UB |
| Postcode | OX15 4AA |
| Latitude | 52.0394160752 |
| Longitude | -1.32847520628 |
| Country | England |
| NHS Health Authority | South Central |
| Parliamentary Constituency | Banbury |
| European Electoral Region | South East |
| Primary Care Trust | Oxfordshire |
| Region | South East |
| Admin County | Oxfordshire |
| ONS Code | E07000177 |
Political Make Up of Cherwell District Council
| Type | LC |
|---|---|
| Party with Overall Control | CON |
| Labour | 9 |
| Liberal Democrats | 7 |
| Conservative Party | 25 |
| Green Party | 2 |
| UK Independence Party | 0 |
| Plaid Cymru - The Party of Wales | 0 |
| Scottish National Party | 0 |
| Democratic Unionist Party | 0 |
| Sinn Féin | 0 |
| Ulster Unionist Party | 0 |
| Social Democratic and Labour Party | 0 |
| Traditional Unionist Voice | 0 |
| Progressive Unionist Party | 0 |
| Independent | 5 |
| Vacant | 0 |
| Electoral Cycle Start Date | 2016 |
| Electoral Cycle End Date | 2030 |
2022 Election Results for Cherwell District Council
| Council Seats up for Election | Third |
|---|---|
| Labour | 10 |
| Liberal Democrats | 7 |
| Green Party | 2 |
| Conservatives | 25 |
| Others | 4 |
| Vacant Seats | 0 |
Waste and Recycling Rates for Cherwell District Council 2017-18
Waste Recycling Performance
31 (8.99%) of local authorities perform better than Cherwell District Council.
313 (90.72%) of local authorities perform worse than Cherwell District Council.

| Authority Type | Collection |
|---|---|
| Waste per household KG | 424.3 |
| Percentage of household waste sent for reuse, recycling or composting | 55.60% |
| Collected household waste per person (kg) | 408.4 |
Employee Headcount for Cherwell District Council
FTE = Full Time Equivalent
| Region | South East |
|---|---|
| Total Headcount | 502 |
| Total FTE | 462 |
| Male Full Time | 244 |
| Female Full Time | 149 |
| Male Part Time | 10 |
| Female Part Time | 99 |
| Permanent | 470 |
| Temporary/Casual | 32 |
| Male | 254 |
| Female | 248 |
| Full-time | 393 |
| Part-Time | 109 |
| Male Full Time perm | 235 |
| Female Full Time perm | 135 |
| Perm Male | 244 |
| Perm Female | 226 |
| Perm Full-time | 370 |
| Perm Part-time | 100 |
| Male total FTE perm | 241 |
| Female total FTE perm | 191 |
| Male Full Time temp | 9 |
| Female Full Time temp | 14 |
| Temp Male | 10 |
| Temp Female | 22 |
| Temp Full-time | 23 |
| Temp Part-time | 9 |
| Male total FTE temp | 10 |
| Female total FTE temp | 20 |