
Advertisement
Warwick District Council
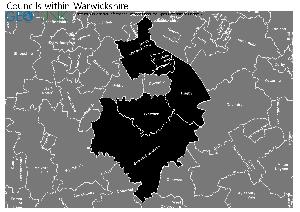
Map of the Warwick District Council Area
The area shaded blue on the map represents the extent of Warwick District Council. The map pin represents the location of the council offices.
Waste Recycling Performance
56 (16.33%) of local authorities perform better than Warwick District Council.
286 (83.38%) of local authorities perform worse than Warwick District Council.
Warwick District Council has a population of 135,700.
Warwick District Council is within the ceremonial county of Warwickshire
click to enlarge
Download Print Quality PDF of Councils in Warwickshire
Councils Neighbouring Warwick District Council
Wards within Warwick District Council
click to enlarge
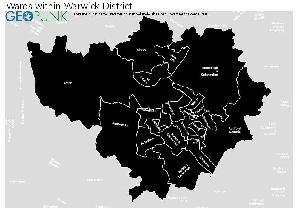
- St John's
- Saltisford
- Stoneleigh & Cubbington
- Sydenham
- Whitnash
- Woodloes
- Abbey
- Arden
- Aylesford
- Bishop's Tachbrook
- Brunswick
- Budbrooke
- Clarendon
- Crown
- Emscote
- Leam
- Manor
- Milverton
- Myton & Heathcote
- Newbold
- Park Hill
- Radford Semele
Download Print Quality PDF of Wards in Warwick District Council
Warwick District Council Contact Details
| Website | http://www.warwickdc.gov.uk/ |
| Contact Us Page | http://www.warwickdc.gov.uk/contactus |
| Address | Riverside House |
| Milverton Hill | |
| Town | Leamington Spa |
| Postcode | CV32 5HZ |
| Telephone Number Description | Switchboard |
| Telephone Number | 01926 450 000 |
| Fax Number | 01926 456 509 |
| Main Contact Email | contactus@warwickdc.gov.uk |
Details for Warwick District Council
| Local Authority Name | Warwick District Council |
| SNAC Code | 44UF |
| Postcode | CV32 5HZ |
| Latitude | 52.289518019 |
| Longitude | -1.54344420155 |
| Country | England |
| NHS Health Authority | West Midlands |
| Parliamentary Constituency | Warwick and Leamington |
| European Electoral Region | West Midlands |
| Primary Care Trust | Warwickshire |
| Region | West Midlands |
| Admin County | Warwickshire |
| ONS Code | E07000222 |
Waste and Recycling Rates for Warwick District Council 2017-18
Waste Recycling Performance
56 (16.33%) of local authorities perform better than Warwick District Council.
286 (83.38%) of local authorities perform worse than Warwick District Council.

| Authority Type | Collection |
|---|---|
| Waste per household KG | 394.9 |
| Percentage of household waste sent for reuse, recycling or composting | 52.30% |
| Collected household waste per person (kg) | 368.8 |
Employee Headcount for Warwick District Council
FTE = Full Time Equivalent
| Region | West Midlands |
|---|---|
| Total Headcount | 507 |
| Total FTE | 451 |
| Male Full Time | 190 |
| Female Full Time | 172 |
| Male Part Time | 32 |
| Female Part Time | 113 |
| Permanent | 451 |
| Temporary/Casual | 56 |
| Male | 222 |
| Female | 285 |
| Full-time | 362 |
| Part-Time | 145 |
| Male Full Time perm | 174 |
| Female Full Time perm | 146 |
| Perm Male | 197 |
| Perm Female | 254 |
| Perm Full-time | 320 |
| Perm Part-time | 131 |
| Male total FTE perm | 189 |
| Female total FTE perm | 212 |
| Male Full Time temp | 16 |
| Female Full Time temp | 26 |
| Temp Male | 25 |
| Temp Female | 31 |
| Temp Full-time | 42 |
| Temp Part-time | 14 |
| Male total FTE temp | 21 |
| Female total FTE temp | 29 |