
Advertisement
City of Westminster
Map of the City of Westminster Area
The area shaded blue on the map represents the extent of City of Westminster. The map pin represents the location of the council offices.
Waste Recycling Performance
343 (99.42%) of local authorities perform better than City of Westminster.
1 (0.29%) of local authorities perform worse than City of Westminster.
City of Westminster has a population of 236,000.
City of Westminster is within the ceremonial county of Greater London
click to enlarge
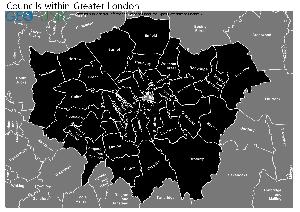
Download Print Quality PDF of Councils in Greater London
Councils Neighbouring City of Westminster
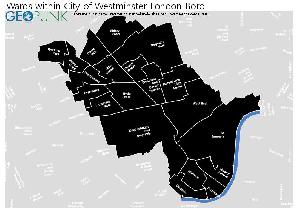
Wards within City of Westminster
click to enlarge
- Knightsbridge and Belgravia
- Lancaster Gate
- Little Venice
- Maida Vale
- Marylebone High Street
- Queen's Park
- Regent's Park
- St James's
- Tachbrook
- Vincent Square
- Warwick
- Westbourne
- West End
- Abbey Road
- Bayswater
- Bryanston and Dorset Square
- Churchill
- Church Street
- Harrow Road
- Hyde Park
Download Print Quality PDF of Wards in City of Westminster
City of Westminster Contact Details
| Website | http://www.westminster.gov.uk/ |
| Contact Us Page | http://www.westminster.gov.uk/contact |
| Address | P.O. Box 240 |
| Westminster City Hall | |
| Town | London |
| Postcode | SW1E 6QP |
| Telephone Number Description | Customer enquiry line |
| Telephone Number | 020 7641 6000 |
| Fax Number | 020 7645 5510 |
Details for City of Westminster
| Local Authority Name | City of Westminster |
| SNAC Code | 00BK |
| Postcode | SW1E 6QP |
| Latitude | 51.4975521719 |
| Longitude | -0.137377275534 |
| Country | England |
| NHS Health Authority | London |
| Parliamentary Constituency | Cities of London and Westminster |
| European Electoral Region | London |
| Primary Care Trust | Westminster |
| Region | London |
| Admin County | |
| ONS Code | E09000033 |
Political Make Up of City of Westminster
| Type | LC |
|---|---|
| Party with Overall Control | LAB |
| Labour | 31 |
| Liberal Democrats | 0 |
| Conservative Party | 23 |
| Green Party | 0 |
| UK Independence Party | 0 |
| Plaid Cymru - The Party of Wales | 0 |
| Scottish National Party | 0 |
| Democratic Unionist Party | 0 |
| Sinn Féin | 0 |
| Ulster Unionist Party | 0 |
| Social Democratic and Labour Party | 0 |
| Traditional Unionist Voice | 0 |
| Progressive Unionist Party | 0 |
| Independent | 0 |
| Vacant | 0 |
| Electoral Cycle Start Date | 2016 |
| Electoral Cycle End Date | 2030 |
2022 Election Results for City of Westminster
| Council Seats up for Election | All |
|---|---|
| Labour | 31 |
| Liberal Democrats | 0 |
| Green Party | 0 |
| Conservatives | 23 |
| Others | 0 |
| Vacant Seats | 0 |
Waste and Recycling Rates for City of Westminster 2017-18
Waste Recycling Performance
343 (99.42%) of local authorities perform better than City of Westminster.
1 (0.29%) of local authorities perform worse than City of Westminster.

| Authority Type | Unitary |
|---|---|
| Waste per household KG | 566.4 |
| Percentage of household waste sent for reuse, recycling or composting | 18.80% |
| Collected household waste per person (kg) | 356.2 |
Employee Headcount for City of Westminster
FTE = Full Time Equivalent
| Region | London |
|---|---|
| Total Headcount | 2853 |
| Total FTE | 1894 |
| Male Full Time | 763 |
| Female Full Time | 951 |
| Male Part Time | 406 |
| Female Part Time | 730 |
| Permanent | 2193 |
| Temporary/Casual | 659 |
| Male | 1170 |
| Female | 1682 |
| Full-time | 1715 |
| Part-Time | 1137 |
| Male Full Time perm | 751 |
| Female Full Time perm | 928 |
| Perm Male | 901 |
| Perm Female | 1291 |
| Perm Full-time | 1680 |
| Perm Part-time | 512 |
| Male total FTE perm | 789 |
| Female total FTE perm | 1068 |
| Male Full Time temp | 11 |
| Female Full Time temp | 22 |
| Temp Male | 268 |
| Temp Female | 390 |
| Temp Full-time | 34 |
| Temp Part-time | 624 |
| Male total FTE temp | 12 |
| Female total FTE temp | 25 |